Dear editor,
Eunice Newton Foote, an American scientist, was the first to discover the gas CO2 can have a heating effect on the planet.
She did this by filling glass jars with different amounts of water vapor, carbon dioxide, and air. She compared how much they heated up in the sun, and then presented her data to the top US Science Conference in 1856. As more data came in over the next decades, scientists studying the problem started getting concerned, even back then.
| The graphic plotting CO2 in the atmosphere, called the Keeling Curve, is named after the man who created it, Charles David Keeling. The annual mean growth rate when the Keeling Curve started in 1958 was 0.5 ppm rise a year over a decade. Today it is a 2.5 ppm mean annual rise on average over the last decade. |
The chart on the left is a close-up of the one on the right. It shows what some scientists call the seasonal breathing cycles of the planet. CO2 decreases by over seven ppm during the spring and summer months, when the northern hemisphere trees and plants grow, absorbing CO2 out of the atmosphere. During the fall and winter, it rises again when plants die, decompose, and trees lose their leaves, which exhales CO2 back into the Atmosphere.
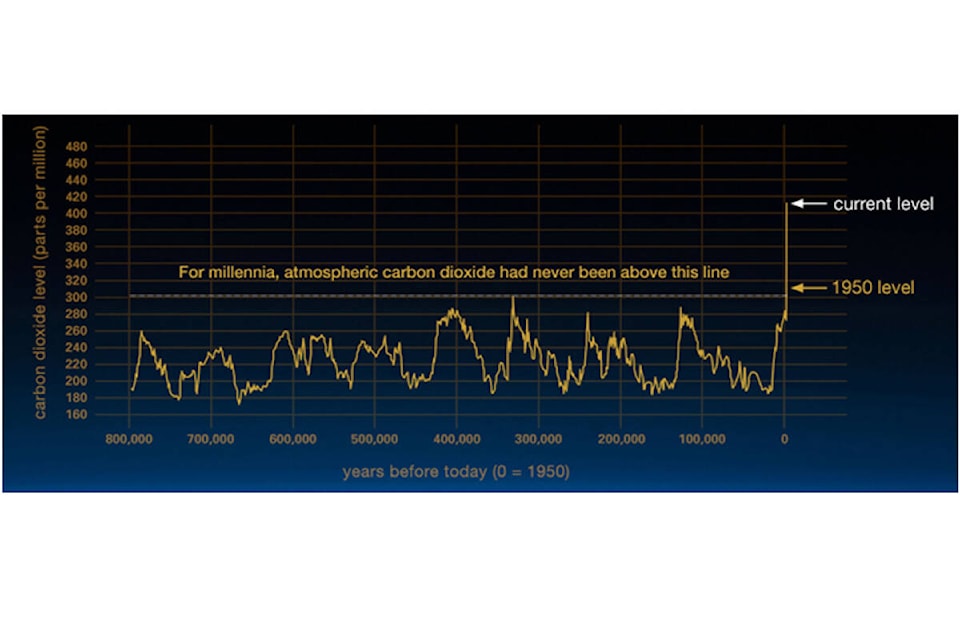
The 800,000-year historical graphic shows data collected by scientists drilling ice core samples from the Antarctic ice cap. The air bubbles found in the cores provide clean samples of what the atmosphere was like when that layer of ice was laid down. The bubbles are measured for methane, carbon dioxide, and oxygen. As shown in the chart, CO2 levels never exceeded 300 ppm throughout this era, and most of the time, were under 280 ppm until the industrial revolution.
By 1988 NASA Climate scientist James Hanson had enough data to testify in front of the US Congress, and although he didn’t use the fancy political term “build back better,” he was saying precisely that. In the 34 years that have passed, we have had 26 COP (Conference of the Parties) meetings, the first one being in Berlin, Germany 1995, and the latest, COP 26, last year in Glasgow, UK. Unfortunately, nobody listened to the scientists when they told us to build back better back in the late 1980s. Climate scientists are now saying to “stop” putting carbon in the atmosphere.
Will we listen this time?
With atmospheric rivers, wildfires, heat domes, droughts and who knows how many unknowns, British Columbians already are experiencing the dangers of living on a planet with over 400ppm CO2 in the atmosphere.
At the time of this writing, April 8, 2022, the measured CO2 from the Mauna Loa Observatory was 420.66 ppm.
(Sources: https://bit.ly/3O5U4Tp, https://gml.noaa.gov/ccgg/trends/monthly.html, https://gml.noaa.gov/ccgg/trends/gr.html )
Fred Fern,
Merville